Maps are essential tools for understanding and interpreting spatial information. While general reference maps provide an overview of physical and political features, thematic maps focus on specific subjects or themes, such as population density, climate patterns, or economic activities. These maps use colors, symbols, and visual techniques to highlight trends and relationships within a dataset, making complex information more accessible.
Thematic maps play a crucial role in various fields, including geography, environmental science, business, and urban planning. They help researchers, policymakers, and analysts visualize and interpret data effectively, aiding in better decision-making and problem-solving. Whether tracking climate change, analyzing demographic shifts, or mapping election results, thematic maps offer valuable insights into the world around us.
In this article we’ll discuss about the What is a thematic map used for.
Let’s dive in:
Common Uses of Thematic map
Thematic maps serve as powerful tools for visualizing and analyzing specific data sets across various fields. Thematic maps help researchers, policymakers, and analysts interpret spatial patterns and trends, making them valuable in different applications. Below are some common uses of thematic maps:
1. Geographical Analysis
Thematic maps are widely used in geography to study physical landscapes and environmental patterns.
- Climate Patterns (Temperature, Rainfall) – Maps displaying temperature variations, rainfall distribution, or weather trends help in understanding climatic conditions and forecasting weather.
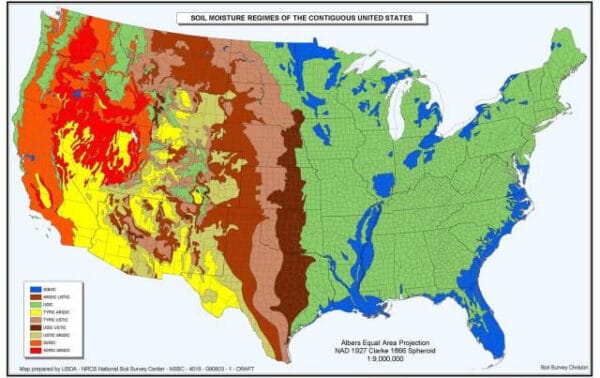
- Vegetation and Soil Types – These maps illustrate different vegetation zones, soil compositions, and their suitability for agriculture and conservation efforts.
2. Demographic Studies
Thematic maps provide insights into population characteristics and distribution.
- Population Density and Distribution – These maps highlight areas with high or low population density, assisting in urban planning and resource allocation.
- Age, Gender, and Income Statistics – They help analyze demographic factors such as age groups, gender ratios, and income levels, supporting social and economic research.
3. Economic and Industrial Applications
Businesses and governments use thematic maps to understand economic activity and industry locations.
- Trade Routes and Resource Distribution – These maps illustrate transportation networks, global trade flows, and the distribution of resources like oil, minerals, and agricultural products.
- Agricultural and Industrial Zones – Thematic maps help identify regions dedicated to specific types of farming or industrial production, aiding in economic planning and investment decisions.
4. Environmental Monitoring
Environmental scientists and policymakers use thematic maps to track ecological changes and threats.
- Deforestation and Land Use Changes – These maps show the transformation of forests into agricultural or urban areas, helping in conservation and land management efforts.
- Pollution and Natural Disaster Impact – Maps depicting air and water pollution levels, as well as areas affected by floods, hurricanes, or wildfires, are crucial for disaster preparedness and mitigation.
5. Political and Social Insights
Governments, political analysts, and public health experts use thematic maps to visualize electoral and social trends.
Spread of Diseases and Healthcare Accessibility – Thematic maps help track the spread of epidemics and identify areas with limited healthcare facilities, aiding in public health planning.Common Uses of Thematic Maps
Election Results and Voting Patterns – These maps display voter preferences by region, providing insights into political shifts and trends.
Thematic maps are essential tools in various domains, from environmental science to economics and public policy. By presenting data visually, they make it easier to identify trends, make informed decisions, and develop strategies for sustainable development.
Difference Between Thematic and General Reference Maps
Maps serve as essential tools for understanding spatial information, but not all maps are created for the same purpose. Two primary types of maps are thematic maps and general reference maps, each serving distinct functions in geographic representation.
1. General Reference Maps
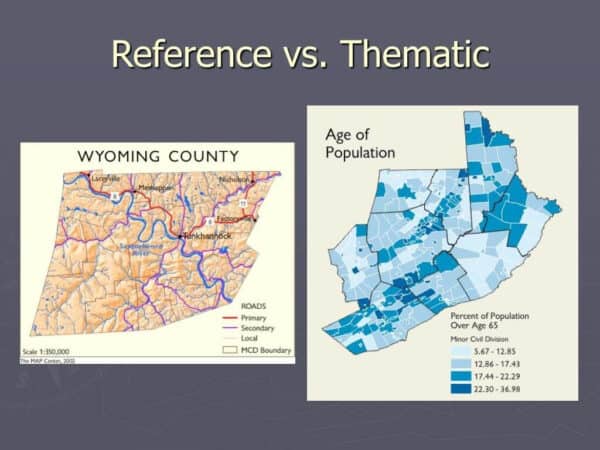
General reference maps provide a broad view of geographic features and are designed for everyday use. They depict natural and man-made landmarks such as mountains, rivers, roads, cities, and political boundaries. These maps aim to offer a clear representation of an area’s physical and political landscape without focusing on specific themes.
Examples of General Reference Maps:
- Topographic Maps – Show elevation, terrain, and landscape features.
- Road Maps – Display highways, streets, and transportation routes.
- Political Maps – Outline countries, states, and administrative boundaries.
2. Thematic Maps
Thematic maps, on the other hand, focus on a particular subject or dataset rather than general geographic details. They emphasize specific information, such as climate patterns, population density, economic activities, or disease outbreaks. While they still include base maps for spatial context, their main purpose is to highlight trends and relationships in the chosen theme.
Examples of Thematic Maps:
- Choropleth Maps – Use color gradients to represent data (e.g., population density).
- Weather Maps – Show temperature, precipitation, or storm paths.
- Election Maps – Illustrate voting patterns and election results.
Key Differences Between Thematic and General Reference Maps
| Feature | General Reference Maps | Thematic Maps |
|---|---|---|
| Purpose | Provide a broad geographic overview | Focus on a specific theme or dataset |
| Content | Includes roads, cities, rivers, terrain | Highlights data trends like climate, population, or economy |
| Usage | Navigation, education, general reference | Data analysis, research, and visualization |
| Examples | Road maps, topographic maps, political maps | Weather maps, economic maps, demographic maps |
Both types of maps are valuable for different purposes. While general reference maps help with navigation and geographic orientation, thematic maps provide insights into specific trends and relationships, making them essential for research, decision-making, and planning.
Key Features of Thematic Maps
Thematic maps are designed to highlight specific data and provide a visual representation of patterns, trends, and distributions. They differ from general reference maps by focusing on a single subject rather than displaying a broad range of geographic features. Below are the key features that define thematic maps:
1. Focus on Specific Themes or Topics
The primary characteristic of a thematic map is its emphasis on a particular theme or dataset rather than general geographic information. These maps are used to represent subjects such as:
- Climate and weather patterns (e.g., temperature variations, rainfall distribution)
- Population statistics (e.g., density, age distribution, economic status)
- Land use and resource allocation (e.g., agricultural zones, deforestation areas)
- Political and social trends (e.g., election results, migration patterns)
Thematic maps help in analyzing and understanding spatial relationships within a given topic, making complex information easier to interpret.
2. Use of Colors, Symbols, and Patterns
To effectively convey information, thematic maps use various visual elements such as:
- Colors – Different shades or color gradients are used to show intensity or distribution of data. For example, a population density map may use darker colors for highly populated areas and lighter colors for less populated regions.
- Symbols – Dots, icons, and shapes are often used to represent specific data points, such as cities, resources, or population clusters.
- Patterns and Shading – Cross-hatching, contour lines, or texture variations are used to distinguish different areas based on the represented data.
By utilizing these visual techniques, thematic maps enhance readability and make it easier for users to interpret trends.
3. Types of Data Representation (Qualitative vs. Quantitative)
Thematic maps can be classified based on how they represent data:
Qualitative Thematic Maps
- Used to display categorical data that does not involve numerical values.
- Show differences in types, categories, or classifications rather than numerical intensity.
- Examples:
- Land use maps (e.g., forests, farmlands, urban areas)
- Political maps (e.g., countries, states, territories)
Quantitative Thematic Maps
- Represent numerical data to indicate variations in intensity, magnitude, or density.
- Examples:
- Choropleth maps (color-coded based on statistical values, such as population density)
- Isoline maps (contour lines showing temperature, elevation, or atmospheric pressure)
- Dot density maps (using dots to show frequency or distribution of a variable)
Thematic maps are essential for visually communicating data related to specific themes. Their use of colors, symbols, and patterns enhances data comprehension, while their ability to represent both qualitative and quantitative information makes them versatile tools in research, analysis, and decision-making.
Types of Thematic Maps
Thematic maps come in various forms, each designed to represent specific types of data effectively. Below are five common types of thematic maps and their unique characteristics.
1. Choropleth Maps (Color-Coded Data Representation)
A choropleth map uses different shades of colors to represent statistical values across predefined geographic areas, such as countries, states, or districts.
- Purpose: Displays variations in data intensity, such as population density, income levels, or election results.
- Example: A map showing different shades of blue to represent varying literacy rates across different states.
- Advantage: Easy to interpret as it provides a clear visual comparison of regions.
- Limitation: Can sometimes oversimplify data by generalizing values within geographic boundaries.
2. Dot Density Maps (Distribution of Phenomena)
Dot density maps use dots to represent the occurrence or concentration of a particular phenomenon in a given area. Each dot corresponds to a specific quantity of data.
- Purpose: Shows the spatial distribution of a variable, such as population distribution, crime rates, or disease outbreaks.
- Example: A map displaying dots to indicate the number of COVID-19 cases in different cities.
- Advantage: Provides an accurate visual representation of how data is spread across a region.
- Limitation: Overlapping dots in densely populated areas may make interpretation difficult.
3. Isoline Maps (Contour Lines for Weather, Elevation)
Isoline maps use continuous lines to connect points of equal value, commonly used for representing natural phenomena.
- Purpose: Depicts gradual changes in data such as temperature, elevation, or atmospheric pressure.
- Example: A weather map with contour lines showing areas with the same temperature levels.
- Advantage: Effectively illustrates gradual changes in data over a large area.
- Limitation: Can be complex to read if too many lines are used.
4. Cartograms (Size of Areas Adjusted for Data Representation)
Cartograms distort the size of geographic regions based on a specific data variable rather than actual land area.
- Purpose: Emphasizes the relative magnitude of a variable, such as GDP, population, or internet usage.
- Example: A world map where countries with higher populations appear larger, while less populated ones shrink.
- Advantage: Provides a powerful visual impact to highlight differences in data.
- Limitation: Geographical accuracy is sacrificed, which can make navigation difficult.
5. Flow Maps (Movement of Goods, Migration Patterns)
Flow maps use arrows or lines of varying thickness to represent the movement of people, goods, or information between locations.
- Purpose: Tracks movement trends such as trade routes, migration flows, or transportation networks.
- Example: A map showing migration patterns from rural to urban areas.
- Advantage: Effectively visualizes the direction and volume of movement.
- Limitation: Can become cluttered if too many flow lines overlap.
Different types of thematic maps serve specific purposes, helping users analyze data patterns in various fields. Whether showing population distribution, climate changes, or economic trends, thematic maps provide valuable insights that support decision-making and research.
Advantages and Limitations of Thematic Maps
Thematic maps are powerful tools for visualizing data and understanding spatial relationships. However, like any mapping technique, they have both strengths and limitations.
Advantages of Thematic Maps
1. Easy Visualization of Complex Data
Thematic maps simplify large datasets by presenting information visually. Using colors, patterns, and symbols, they make it easier to identify relationships and trends that might be difficult to grasp in raw statistical form.
2. Enhances Decision-Making and Planning
Governments, businesses, and researchers rely on thematic maps for informed decision-making. They assist in urban planning, environmental management, public health strategies, and resource allocation by highlighting key data trends.
3. Provides Insights into Trends and Patterns
By illustrating spatial distributions, thematic maps help in understanding social, economic, environmental, and political patterns. For example, they can reveal migration trends, climate change effects, or economic disparities across regions.
Limitations of Thematic Maps
1. Potential for Misinterpretation
If not designed carefully, thematic maps can be misleading. The use of inappropriate color schemes, incorrect data classification, or exaggerated visual elements may distort the information.
2. Dependence on Accurate Data
The reliability of a thematic map depends entirely on the quality and accuracy of the data it represents. Errors in data collection or outdated information can lead to incorrect conclusions.
3. Limited Scope if Not Properly Designed
Some thematic maps focus on a single theme, which may not provide a complete picture of a situation. For example, a population density map may not account for economic factors that influence distribution, requiring additional maps for context.
Conclusion
Thematic maps play a crucial role in modern mapping and data analysis by providing clear visual representations of various subjects. Their ability to simplify complex information, support decision-making, and reveal trends makes them essential tools across multiple disciplines. However, their effectiveness depends on accurate data collection and careful design to avoid misinterpretation. When used correctly, thematic maps are invaluable for research, planning, and policy development in an increasingly data-driven world.


