Rows and Columns are blocks used in various softwares to distinguish different aspects. It further helps to organize the data in a structured manner. In this article, we will tell you everything about Rows and Columns. Give it a read to clarify your problems, if there are some.
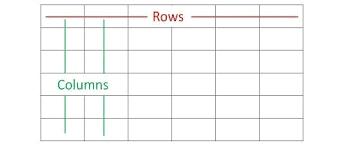
ROW: A row refers to a horizontal line of cells that run from left to right across a table or spreadsheet.
COLUMN: A column refers to a vertical line of cells arranged from top to bottom.
What Is The Difference Between Row and Column?
| ROW | COLUMN |
| A row is a series of data banks put out horizontally in a table or spreadsheet. | A column is a vertical series of cells in a chart, table, or spreadsheet. |
| Rows go across left to right | Columns are arranged from up to down. |
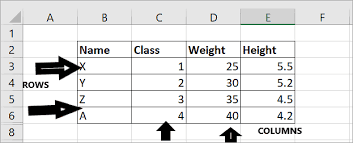
| In a spreadsheet such as MS Excel WPS, LibreOffice, or Google sheet, the row heading is indicated by numbers. | In spreadsheet programs like excel, LiberOfifce column headings are denoted by letters. |
| In the database, the information like name, gender, names, are placed in the rows. | The column contains information about someone who you are mentioning in the rows. |
| In a matrix, the horizontal arrays are also called rows. | In a matrix, the vertical arrays are also called columns. |
| In database management systems like MS Access or FoxPro rows are known as the record, which contains fields. | columns are known as the field, which is a collection of characters. |
| The total of the values of rows is shown at extreme right. | The total of the values of columns is shown at the extreme bottom. |
| A row is labeled with numeric values | A column is labeled with alphabets |
| Row-oriented data stores are best suited for online transaction systems. | Column-oriented stores are best suited for online analytical processing. |
Row Examples:
Here are real-life examples of Row:
- The children are standing one after another.
- Group of people standing in a row at the back of the room.
- Building a row of houses alongside the river.
- Students are standing on the front row of the stalls.
Column Examples:
Here are real-life examples of the column:
- Weekly recipe Item
- Pillar in the front of a building
- A facade with marble columns
Why Rows And Columns Are Important In Organizing Data?
- Clarity and Readability: It gives you a clear and understandable format. Imagine if things would not have been organized, they would have been so messy and jumbled up. So for the same reason separation is very important.
- Efficiency in Analysis: Storing data by category or filtering specific items becomes a breeze with tools like spreadsheets and databases. This makes things easy like identifying trends, comparing points, and drawing conclusions.
- Consistency: Consistency allows different software programs and people to understand and work with the data seamlessly.
- Flexibility: Whether you’re managing a customer list of 10 or 10,000, rows and columns can adapt. New data points can be easily added as new rows, and additional categories can be introduced as new columns.
Rows and columns Uses :
- Charts and Graphs: Rows and columns are the hidden heroes behind many charts and graphs. Data points are plotted based on their position in a row (x-axis) and column (y-axis), allowing for visual representation of trends and relationships.
- Calendars: Days are arranged in rows (weeks), with each day further divided into time slots (columns). This facilitates easy visualization of schedules and appointments.
- Seating Charts: Rows and columns come alive in seating arrangements at theaters, stadiums, or classrooms. Rows represent sections and columns signify individual seats within those sections, enabling organized seating allocation.
- Traffic Flow: Lanes on a road function as rows, allowing for organized movement of vehicles and pedestrians.
- Games: Board games like chess or checkers utilize a grid structure defined by rows and columns for gameplay.
Limitations of Rows And Columns:
- Rows and columns lack complex hierarchical relationships between data points.
- It can handle only graph databases perfectly, with limited ability to capture the context or relationship between data points.
- Rows and columns are inherently two-dimensional. Data with more than two dimensions, like weather data with location,time, and temperature, can be awkward to represent in a table.
FAQs
- What is an example of a Row-Oriented Database?
Some common examples of Rows-Oriented databases are PostgreSQL and MySQL.
- What is an example of a Column-Oriented Database?
Some common examples of Column-Oriented Databases are Apache Cassandra, ScyllaDB, etc.
- How many rows and columns can MS Excel handle?
MS Excel can have up to a maximum of 1,048,576 rows and 16384 columns.
Conclusion
Rows and columns have established themselves as the cornerstone of data organizations. A powerful mechanism that simplifies, clarifies various things . While they might have limitations in representing complex data structures or large datasets.
